News
Stay informed
What is going on in the market?
Our experts follow the news that may be relevant to the insurance market. We provide commentary on interesting developments. We are happy to think along with you about your future.
To inflate or not to inflate, that is the next question?
Melchior Mattens MSc AAG
melchior.mattens@arcturus.nl
Since March 2022, inflation in the Netherlands has been rising enormously as a result of increasing energy prices due to the war in Ukraine. For example, in its September forecast, the CPB expects [1]inflation (Consumer Price Index, hereinafter CPI) to amount to 9.9% in 2022 and to fall to 2.6% in 2023. In December, DNB issued a more alarming forecast: in 2023 and 2024, the HIPC (Harmonized Consumer Price Index) would end up at 4.9% and 5.0%, provided the energy prices drop sharply [2]. According to DNB, core inflation (excluding energy and food) will be 4.8% and 2.8% in 2023 and 2024. For 2022, the CBS estimates a realized CPI of 9.6%.
Because inflation is exceptionally high in 2022 and inflation may also remain extremely high in the coming years, the question quickly arises which inflation figures are now relevant for the valuation of the technical provisions and how a non-life insurer should incorporate inflation in the technical provisions? As a follow-up from our earlier article on inflation, we will take a closer look at this in this article.

Melchior Mattens MSc AAG
melchior.mattens@arcturus.nl
Inflation
Inflation for a non-life insurer often deviates from the consumer price index (CPI). This is because insurance claims often have their own inflation pattern. Think of personal injury claims, where additions to the WAM (Dutch Motor Vehicle Liability Legislation), such as affection claims, have led to a completely different inflation pattern than the CPI. But building materials or car parts also have very different inflation rates than the CPI. In addition, an insurance portfolio for motor vehicles is affected by the fact that in recent years cars have received more and more integrated technology, as a result of which making repairs have become much more expensive.
The CBS [1]provides insight into the current state of the CPI. The CPI drops sharply from 14.3% in October to 9.6% in December. This indicates that the projection of the CPB from September for the whole of 2022 was a realistic estimate. In addition, the CBS provides insight into the various product categories and their contribution to the CPI. For December, it appears that more than 3 percentage points of the 9.6% CPI, are caused by inflation in energy, i.e., the price increase of other products and services accounts for 6.6 percentage points of inflation. The change in the CPI in December, compared to October, is almost exclusively due to a fall in energy prices.
As a yardstick for the future claims costs, as used in the premium setting of insurers, the historical claim costs and the observed inflation play an important role. However, the impact of inflation depends on the risk profile of the product. It is therefore important to look at which component is influencing: price, wage and/or product inflation. As a result of the projected increase in inflation, non-life insurance premiums can be expected to increase as well as management costs, in particular as a result of wage developments.
Based on the data currently available with regard to the development of inflation, it can therefore be expected that the total claim costs will increase in the next two years, depending on the inflation forecast used. It is advisable to translate this into a surcharge that is included in the premium setting, while also taking into account the increasing claim costs for reinsurance and thus the price of reinsurance cover to be purchased. In view of the development in the level of inflation and the uncertainty surrounding the forecast, it is recommended to consider a number of scenarios (sensitivity analysis).
The December CPI can be broken down into deeper product categories relevant to the insurance industry. For example, the material component of new-build homes in terms of price index [1]was 12.8% higher in November than a year earlier. The table below provides a breakdown of relevant cost developments for home and contents insurance and for Motor Liability and Casco insurance.

For the Motor Liability portfolio, a combined inflation must be taken into account, whereby for material claims (as for Motor Casco) an average inflation of new car purchases as well as vehicle repairs can be assumed. For personal injury claims, the CPI excluding energy is rather [1]obvious, because this compensation consists of a mixture of loss of working capacity (VAV) and reimbursement of other costs. The VAV in particular will be adjusted in the medium term towards the realized CPI excl. energy (assuming that wages in the longer term will be corrected for the high inflation in 2022), and given that this represents a large part of the incurred loss, this gives a substantiation for assuming the CPI excluding energy for this purpose.
In order to arrive at a general inflation figure for this Line of Business (LoB), a weighting between material claim and personal injury must therefore be determined. We can deduce this from the statistics in various ways:
- When an insurer has information about the historical relationship of incurred losses between injury and material claims, this historical relationship can be used. If data is available for this, it is wise to investigate whether there are trends in the frequency of claims for both personal injury and material claims, as well as for the average claim amounts.
If possible: correct for these trends to obtain a best estimate for the weighting between injury and material claims for the year 2023. - When the data quality does not allow for a historical weighting in one’s own portfolio, public data can be used, among other things, to make a historical weighting between injuries and properties. From the STAR accident registration, we know that for the whole of the Netherlands in 2022, approximately 90,000 accidents have occurred by December 1. Of these, 20,000 involved injuries [2]. If we assume that the relationship between material and personal injuries is approximately the same for one-vehicle and two-vehicle accidents, then 22.2% personal injury claims could be assumed in determining the weighting factors. In order to arrive at a relationship of incurred losses between injury and material claims, an approximation must also be found for the average amount of claims to which we can apply this frequency weighting. For this purpose, the available data of minor and major claims for Motor Liability could be looked at. Practical experience shows that major claims almost always have an injury component and minor claims almost never have it. If a personal injury claim does not exceed a few thousand euros [3], then this usually does not deviate significantly from material claims in terms of inflation development, because it often concerns reimbursement of healthcare costs or temporary support.
[1] Raming Macro Economische Verkenning 2023 (MEV) – cpb.nl
[2] Economie koelt af, inflatie blijft hoog – dnb.nl
[3] Dashboard consumentenprijzen – cbs.nl
[4] StatLine – Nieuwbouwwoningen; inputprijsindex bouwkosten 2015=100 – cbs.nl
[5] We advise the CPI excluding energy because we currently see energy prices falling and are very volatile. Wages seem to be corrected for structural inflation (not energy-related), in which the temporary high energy prices are often compensated by one-off payments from employers. See also the wage cost projection of the CPB.
[6] STAR: Smart Traffic Accident Reporting (star-verkeersongevallen.nl)
[7] Choosing an adequate threshold can be done on the basis of a rule of thumb that personal injury claims with a significant VAV and/or domestic help component can never, as a rule, have an incurred loss of less than 50,000 euros (ie at least 25% loss of work capacity based on full-time minimum wage). (12 x 1,934 euros) for 5 years already leads to an incurred loss of 29,000 euros for the VAV component alone). It is also customary to use a higher threshold than 50,000 euros.
For other branches such as Personal Liability / Corporate Liability, Travel Insurance or Legal Assistance, we see that a mixture of items can be reimbursed from this. It includes both a wage cost aspect and reimbursement of various material claims. Therefore, for such industries, the use of the CPI (excl. energy) for 2022 is justified in our view.
Operating costs are also rising due to inflation. We can assume that these largely consist of personnel costs. These costs are directly linked to the Collective Labor Agreement (Dutch: CAO) for the insurance industry. A best estimate for wage development in 2022 and 2023 is the CPB projection for the CAO-wages of companies, which will amount to 2.9% in 2022 and 3.7% for 2023. DNB estimates that wages will rise by 5% and 4.2% in 2023 and 2024. Due to the great uncertainty, we see DNB’s more conservative estimate as a sensible starting point for the valuation of technical provisions at year-end 2022.
The discussed principles lead to an overview of the proposed inflation percentages to be used per sector and for the costs at the year-end of 2022. Are we there then? Not yet, because we are actually looking for the ‘additional inflation over 2022’. After all, the long-term inflation trend has already been implicitly incorporated in the modeling of the technical provisions, because it is included in the historical claim figures. This generally applies to both the claims provision and the premium provision, because implicit inflation is not only incorporated in many common models for the claims provision (such as the Chain-Ladder), but also in the determination of the premium provision. The latter one happens because the premium base is regularly indexed by many insurers, to which the long-term ratios are then applied.
To determine the additional inflation, one option is to assume the long-term inflation trend to be equal to the ECB’s aim of keeping inflation at 2.0% on average over the long term. However, it is better to use historical claims inflation analysis to find out whether Line of Business-specific inflation deviates significantly from this 2% and to replace this ECB target with it. By deducting the LoB-specific long-term inflation from the figures for 2022, we get an additional inflation figure per LoB for 2022, which can be used in the modeling of the technical provisions.
An example
For home insurance, long-term inflation can be derived from CBS figures on the output price index for construction costs for new homes (see table below). Over the period 2016-2021, average inflation has been 5%. This could be used as a starting point to compare the inflation figures for 2022 (and thus the determination for the additional inflation for home insurance policies).

Solvency II Technical Provisions
Below we discuss how inflation in the claim and premium provisions can be incorporated under Solvency II for non-life insurers. The impact on income protection insurance portfolios is not considered.
Claim provision
Non-life insurers using the Chain-Ladder modeling have to deal with the implicit model assumption that there will be an approximately constant inflation trend per calendar year in the incurred losses over the long term. For 2022 there is a clear deviation from this assumption. We also consider it wise to consider the higher expectations of DNB compared to the CPB for the following years, because there is great uncertainty in the development of inflation. However, the development of the incurred losses should be based on core inflation, because for the vast majority of the non-life portfolio, material claims are covered and the volatility in energy prices (which are currently falling sharply again) may not be consistent with the price development of insured claims.
This means that a correction must be applied to the expected outgoing cash flows for the future years by means of an inflation curve. In this case, the outgoing cash flow in 2023 is corrected with the additional inflation for 2022 and half of the additional inflation for 2023 (six months delay). The cash flow in 2024 will continue to be cumulative with a 50%-50% weighting of the additional inflation for 2023 and 2024, and the cash flow for 2025 will get 50% of the additional inflation for 2024. All cash flows after 2025 will be increased by the same cumulative inflation factor. Because core inflation will again be close to 2% in 2024, according to the DNB, we assume that no further adjustment for additional inflation will be necessary after this horizon.
There seems to be no reason to assume that the payment patterns of the claims reserve also change significantly due to inflation. It is important, however, to monitor for each sector the impact of higher payments on the estimated duration of the settlement of provisions. An adjustment can be made for this purpose in special cases on the basis of expert judgement. The uncertainty this yields, makes it important to (continue to) backtest sufficiently on the difference between the estimate and realization.
The provision for claims handling costs also uses an implied cost inflation component. The adjustment for 2022 can be made by increasing the expected cost amount per year by the additional cost inflation for each outstanding claim. For this purpose, the expected development of the CAO-wages by DNB can be applied (5% on the cost cash flow for 2023 and 9.4% (cumulation of 5% in 2023 and 4.2% in 2024) for 2024 and beyond).
Premium provision
The expected claims ratio, the cost ratio, the reinsured claims , the expected cancellation and the settlement pattern of the incurred losses play a role in the premium provision.
It is important for the premium provision that the Combined Ratio (COR) is adequately adjusted to the inflation expectation. For example, the expected future claims ratio can be determined on the basis of a long-term average of the (annual) claims ratios, taking into account historical inflation and premium adjustments (general inflation correction method). However, at the end of 2022, two things must be taken into account:
- The additional inflation over 2022, 2023 and 2024, which cumulatively increases the claims ratio;
- Adjusted premium rates to correct for inflation, which lowers the claims ratio.
By correcting the premium and claims basis for both effects, a pure estimate of the claims ratio is obtained. The first effect should be determined by weighting the additional inflation using the payment patterns. For multi-year contracts, the applied claims ratios can be adjusted by the same factor. As for the claims provision, it is assumed that core inflation will drop to the long-term average of 2% after 2024, which means that there will probably no longer be any significantly higher technical-claim inflation.
The same considerations apply to the expense ratio, but a different inflation correction is applied to the costs than is applied to the incurred losses, namely with the 5% expected increase in wage costs in 2023. For reinsurance, the inflation adjustments in the reinsurance premium and commission are incorporated in contractual percentages. For the reinsured incurred losses in the premium provision, the reinsured claims ratio continues to be determined on the basis of the gross claims ratio multiplied by the quota share percentage and on the basis of long-term Excess of Loss income (corrected for historically adjusted Quota Share percentages and deductibles) . This ratio relates the reinsured incurred losses to the gross incurred losses. The gross incurred losses have been adequately adjusted for the inflation-expectation, on the basis of the stated method, which means that the reinsured incurred losses have also been sufficiently adjusted automatically.
The economic conditions not only lead to high inflation, but may also lead to higher cancellations in times of recession. In valuing the premium provision at year-end 2022, it may be too prudent to anticipate uncertainty surrounding economic developments and their impact on cancellations. This underlines the importance for non-life insurers to conduct an extensive sensitivity analysis of their assumptions regarding cancellation.
As for the claims provision, a temporarily higher inflation may have an impact on the run-out pattern of the premium provision. As with the claims provision, there seems to be no reason to adjust this pattern, but if it is done on the basis of expert judgement, then it is advisable to also adopt this in the premium provision.
Arcturus continues to build on the future with the entry of new partners and expansion
As of today, Rachel Bonsel, Michiel van Dellen, Patrick Dannenburg and Melchior Mattens have joined Arcturus as partners. Together they bring years of experience within the non-life actuarial field and knowledge in many different areas to the partner team. For the current partners of Arcturus, Jan Hooper and Peter van Kampen, this is a reinforcement of the partner team.
November 17, 2021
After a number of years in which the Arcturus partner team consisted of two partners, the step was taken to expand the team to ensure the long-term continuity of Arcturus and to build a good foundation for future of the company.
Rachel Bonsel
Rachel has been working for Arcturus since 2013. She has made huge strides within the company in recent years. For example, she managed application development teams and is valued by customers for her substantive knowledge and commitment. She is described by colleagues as enthusiastic, eager to learn and solution-oriented. Thanks to her creativity and ideas about improving tooling and processes, she can make an important contribution to the company’s strategy.

Michiel van Dellen
From a rich experience background at various insurers and regulator DNB, Michiel brings a lot of experience to the team. Michiel has been working at Arcturus as an actuarial manager since the beginning of 2019 and has made an important contribution to the services that we offer as a company. In his current role he has also been responsible for performing various second-line actuarial activities for our clients. Michiel can be described as analytical, communicative at different levels and solution-oriented.
Melchior Mattens
Since the beginning of 2016, Melchior has made an important contribution to our organization in many ways. He is always looking for innovative ideas and insights that lead to more adequate risk management. With his knowledge and creativity, he won the Johan de Witt thesis prize in 2017 and was named Actuarial Talent of the Year in 2018. In recent years he has taken on more coordinating roles for clients. He is highly valued by customers for his customer-oriented approach.

Patrick Dannenburg
Patrick joined our team on 1 November. He brings substantive knowledge and years of experience in the non-life actuarial field to the team. He has worked at the regulator DNB, in consultancy and in various other important roles at insurers. In his role as a partner, he will have a responsibility in the execution of the actuarial role and also in acquisition and strategy development.
Reinforcement
We are also pleased to announce that the Arcturus team will be strengthened by the experienced actuary Marco van der Lans as of November 1, 2021. Marco has worked for various insurers and gained a lot of experience in consultancy. From these positions he brings a lot of knowledge about Solvency II and IFRS 17. Marco has a role in acquisition, innovation and support of the actuarial function.
With Marco on board, the team is strengthened with a lot of knowledge and experience and an impulse can be given to, among other things, our customer-oriented innovation projects.
Arcturus
At Arcturus, we are ambitious and want to be among the top actuarial service providers. Permanent further development of our services and products is essential in this regard. The steps above create more space to further shape this. Our aim is and remains unchanged: We are your partner in customized actuarial service.

Cybercrime insurance: what is insurable and how are risks distributed fairly?
Melchior Mattens MSc AAG
melchior.mattens@arcturus.nl
Cybercrime is no longer a new phenomenon as more and more companies and individuals are getting into trouble. Why are non-life insurers not responding more easily to the need for insurance, especially for individuals? In this article Melchior Mattens shows where cyber criminality pinches with the principles of insurance and shines a light on the route to an adequate premium setting.

Melchior Mattens MSc AAG
melchior.mattens@arcturus.nl
Ever-growing problem
Cybercrime is no longer a new phenomenon and more and more people are getting into trouble – according to Dutch police figures there have been almost 7000 cases reported (until August 2020) this year. In recent years in particular, the number of victims of cybercrime has been increasing. As a result, the social demand for professional support from insurers is rising fast. The insurance market already offers coverage, but many insurers are still looking for what role they could play in helping customers in this area. Because what is insurable? And how do you set a good premium for that?

Figurer 1: development of the number of cybercrimes.
Data 2020 until august. Source: data.politie.nl
What is insurable?
Insuring against crime is traditionally a complex matter, because you are dealing with moral hazard: when people know they are insured, they may become (slightly) more careless. This carelessness increases the risk, so criminals can then profit from it. In this way, criminal activities are financed indirectly by insurance money. The most well-known example of this is burglary risk. However, home burglary has been under regular contents cover, so apparently the moral-hazard effect is not so bad: the average insured person does not secure his home less good than the average uninsured.
Moral hazard also plays a role in cybercrime. One difference with home burglary, however, is that cyber criminals can actually demand any ransom amount that they want, whereas there is only so much to steal from a house as the burglars can carry. As a result, the damage burden can be much higher than in the traditional covered forms of crime. If insurers were willing to contribute to this, there could be an incentive for the cyber criminals to increase the demanded ransom structurally. An insured person has become a much more interesting potential target than the uninsured. Of course, an insurer doesn’t want that and should not make crime worth the matter.
Therefore, the first insurers that now offer cyber coverage for individuals (e.g. standard in contents insurance) do not offer cover for the payment of ransom, but for support of cyber experts in case of a (computer) virus infection. In addition, there is a strong effort on prevention: the insurer shares tips, tricks and recent developments in the field of cybercrime with the customer. This makes it easier to avoid problems and means the insured is not on his own if bad luck strikes. In the case of virus infection, assistance is provided by cyber experts; they may be able to repair some of the damage or prevent worse. After all, not all virus infections are such that the computer or data and photos can no longer be recovered from the hackers.
Next to assistance, cyber insurance can also include insured benefits for online scams by webshops and hacking of bank accounts and credit cards. Moral hazard seems less relevant to these risks.
What is an adequate premium?
The risk is not stable, but statistics are indeed needed to assess the risk. How does the frequency of different types of cybercrime develop? This is measured in The Safety Monitor, a biennial population survey conducted by the Central Bureau of Statistics (CBS). Figure 2 breaks down cyber criminality to the four main components.

Figuur 2 Number of offenses per 100 inhabitants by type of cybercrime.
* 2018 is interpolated because of missing data CBS.
The population survey indicates that the 4,700 crimes reported in 2019 (Figure 1) are estimated to be only the tip of the iceberg. With an estimated 23 crimes per 100 inhabitants in 2019, this amounts to a real number of more than 4 million cyber crimes per year in the Netherlands. Insurable offenses include hacking, purchase fraud and identity fraud. Based on the estimation by the survey, there are about 14.5 of these insurable offenses per 100 inhabitants per year in the Netherlands. The subdivision of these 14.5 offenses over to the three insurable types is shown in figure 3.

Figure 3: Percentage share of insurable cybercrime offenses.
By 2020 it is likely that the number of registered crimes will more than double compared to 2019 (figure 1).
These figures can be extrapolated to the future with some caution. With this, one is able to derive an estimate of the claim frequency for the insurable cyber risks. Based on the maximum cover amount, claim handling management and other policy clauses, an estimate of the average claim size can be made. The combination of claims frequency and average claim size can be used to determine an average premium.
Another issue with crime is the unpredictability of the risk. This plays a major role in terrorism: once a country or region has found an appropriate response to a certain type of attack, terrorist organizations develop a new way to achieve their goals. For insurers this implies that the future risk can never be adequately estimated by studying historical data. This also plays a role in cybercrime: on the one hand due to the rapid technological development, on the other hand due to the criminal innovation power. Criminals are constantly looking for new ways as soon as virus protectors have been developed against their current method. An adequate risk premium for the occurrence of these unknown unkowns therefore remains necessary to cover the risk for the insurer.
Premium differentiation possible?
Customer-specific risk factors can hardly be estimated at the moment. A uniform premium is a first step in a young market, but there may be good reasons for moving towards a differentiated system over time. This includes:
- Prevention: some people have invested in good antivirus software;
- Age: Risk awareness and knowledge is not evenly distributed across age groups, and some age groups are more popular targets for cyber criminals.
- Behaviour: some people are relatively more often looking for much more risk, for example downloading certain (illegal) files;
- Job or position: some people are in (business) positions, making them relatively easy to approach and / or making them an attractive target for criminals.
- Tailor-made cover: parts that are priced separately.
As dynamic as the world of cybercrime is, the key to properly assessing risks is data. One learns by doing: insurers who are the first to start insuring cyber risk will be the first to have the data to arrive at good premium differentiation. By properly breaking down this burden of claims according to types of claims (use of experts and compensation) and linking this to risk characteristics of the population, traditional actuarial pricing methods such as GLM are very useful. This makes premium differentiation possible in the long term.
The insurer has something to offer
Overall, developments in the field of cybercrime are moving very quickly. It seems like a matter of time before other insurers will want to enter this market as well. For many people it is a great nightmare to be held hostage by hackers. Good support will therefore be worth something. Fortunately, traditional actuarial pricing methods will also be very useful in this field and therefore it won’t be long till the cyber insurance market becomes a mature market.
The actuarial view on developments COVID-19
Explaining and predicting hospitalization and death
Melchior Mattens MSc AAG
melchior.mattens@arcturus.nl
Could actuarial practice be relevant to epidemiology? There appear to be a surprising number of subjects within the epidemiological situation that affect this practice. The daily RIVM figures on Covid-19 touch on actuarial topics such as IBNR, GLM pricing models, seasonal patterns (time series) and forecasting. By applying actuarial models to this data, insight can be provided into developments in hospital admissions and mortality. These models can also be used to predict future developments and to quantify the uncertainty. The predictive power of the (combined) models can be tested every day. In the article ‘The actuarial view on developments COVID-19’ we show how these models can be combined into robust forecasting models..

Melchior Mattens MSc AAG
melchior.mattens@arcturus.nl
SARS-CoV-2, also known as Covid-19 and Coronavirus, has dominated daily life in the Netherlands and far beyond for some time. The cabinet is assisted in policy choices by the RIVM. In order to fulfill this role as effectively as possible, RIVM collects large amounts of data from hospitals and the GGD in order to gain insight into the spread rate of the corona virus, but also into the development in hospital admissions and mortality. Relevant cross-sections of these data are made available to the public by the RIVM on a daily basis. This includes the number of hospital admissions and deaths by event day, as well as cross sections of patient characteristics.
In this article, we will discuss the type of data that RIVM publishes about the Netherlands and how it should be interpreted. Could actuarial practice be relevant to epidemiology? There appear to be a surprising number of topics within the epidemiological situation which look like this practice: IBNR, time series and forecasting models are just a few examples. In this article, we look at the best available actuarial and econometric models for making a mortality prediction.
Incurred But Not Reported (IBNR)
As mentioned, RIVM publishes the number of admissions and deaths by event day on a daily basis, and adjusts the number of reports from previous event days. Healthcare institutions usually have a reporting delay when someone with a positive Covid-19 test has been admitted or has died. This creates a reporting pattern in the number of admissions and deaths: only after about seven days do we know approximately how many people were actually admitted and died at a specific day. The number of deaths reported in the media daily is the sum of all newly reported deaths since the outbreak in the Netherlands and not just from the previous day.
The actuarial profession is very familiar with the problem that it is not yet exactly clear how many people have been admitted or died. Ideally, one has insight into the actual number of patients admitted and dying today: then trends become visible more quickly and more clearly.
Because we can follow the development for each event date through time, so-called triangular overviews are created of the number of patient admissions and deaths by event day and reporting day. These are shown in the figures below. The problem is that for the most recent days there can still be a lot of development of delayed reports on the number of admissions and deaths. However, the actuarial profession knows what to do with such overviews. A Chain Ladder model can be applied to estimate the total number of admissions and deaths per day. This applies the average run-off pattern from previous days to the numbers already reported at this time.
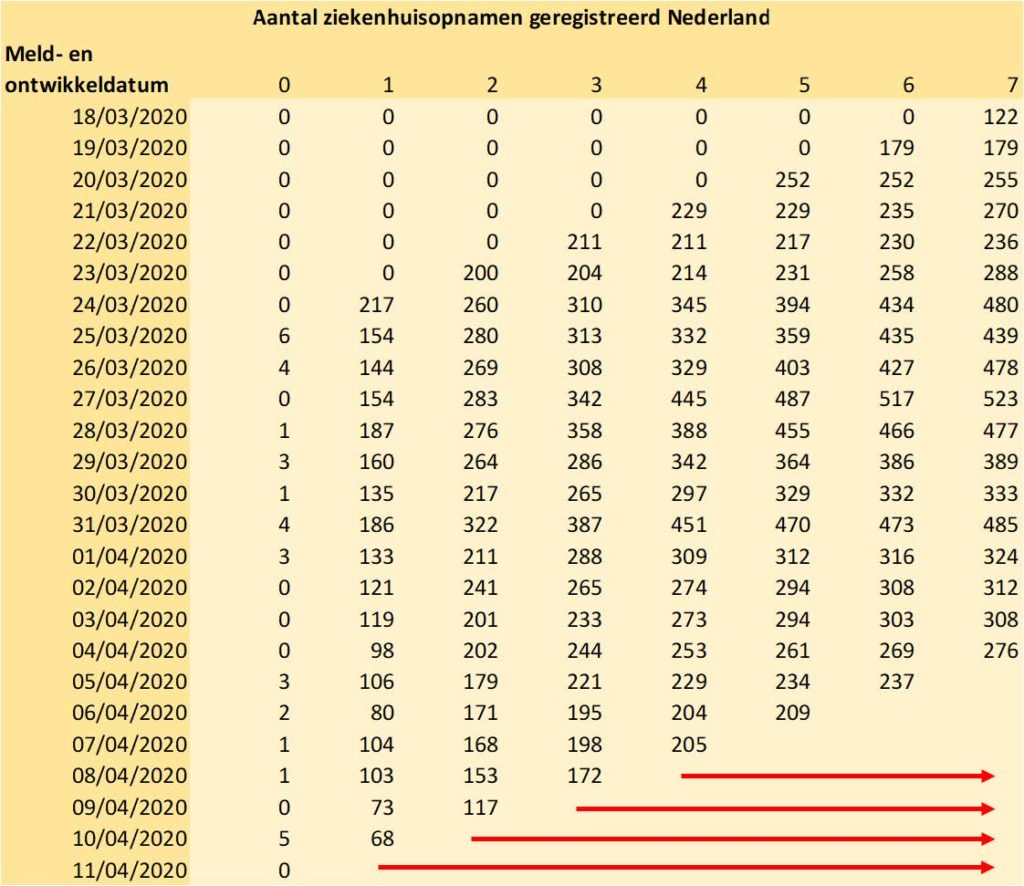
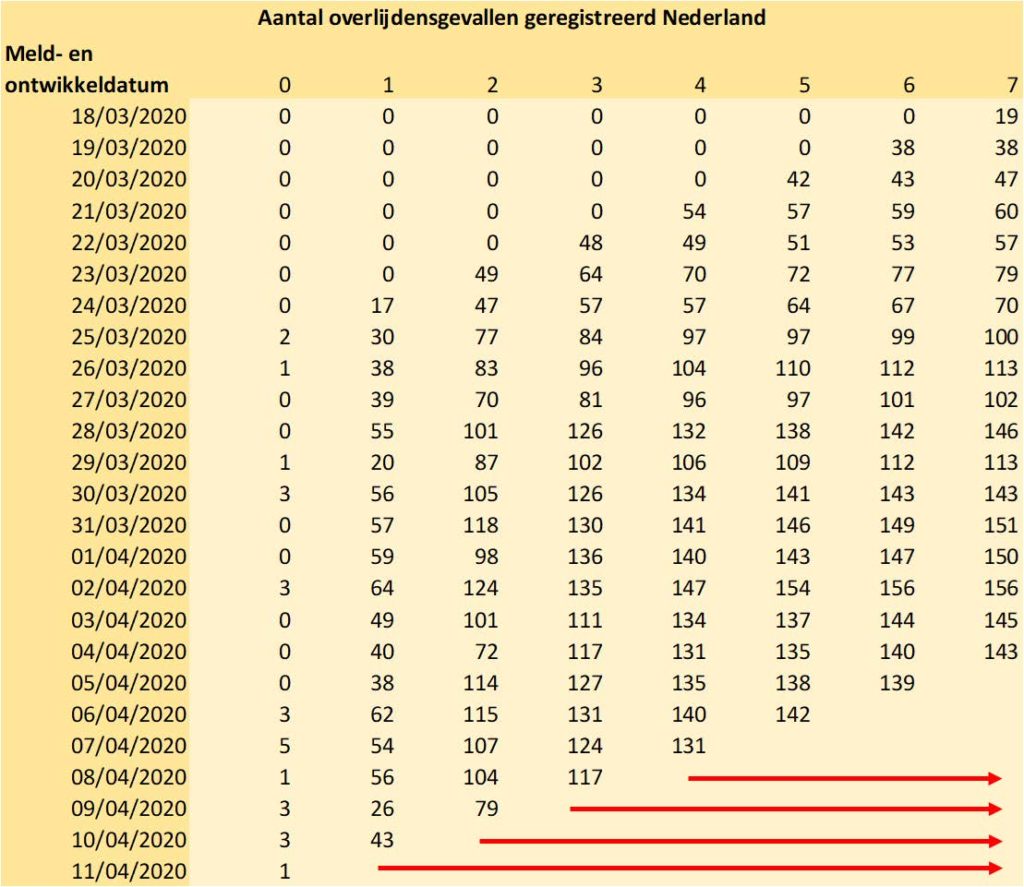
Figures 1 and 2: triangular overviews of admissions and fatalities in the Netherlands. The estimate of the final number is shown with the red arrows.
What is striking about the tables above is that for the last two days there is enormous uncertainty about the actual admissions and deaths. As with many (non-life) insurance policies, an alternative estimation method is needed for this. For example, by looking at the development in the total number of admissions / deaths (ultimate). Using statistical software, the following time series model (ARIMA) can be fitted that provides a projection for the number of hospital admissions and the 95% prediction interval surrounding it.
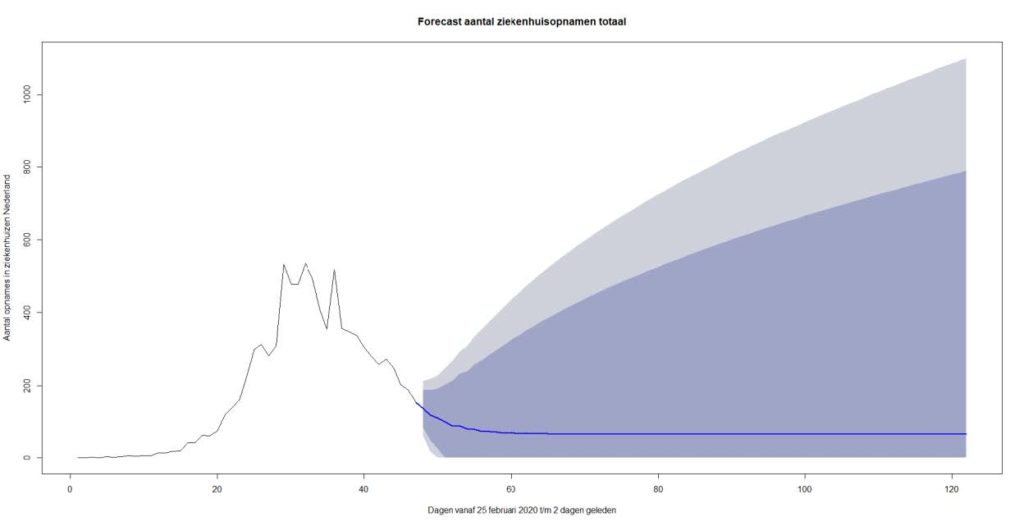
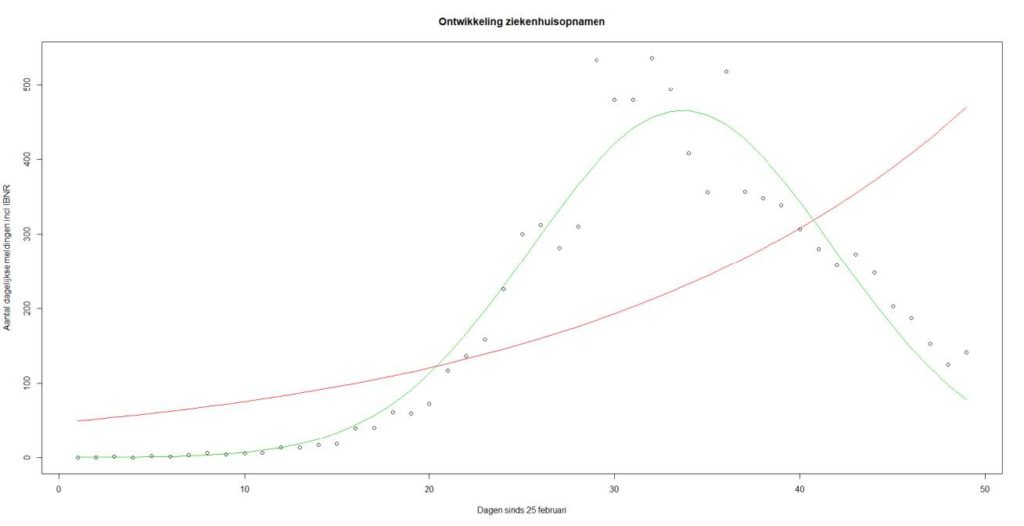
Figure 3: ARIMA model for daily number of hospital admissions in the Netherlands. Forecast up to 75 days ahead. Prediction interval: 75% and 90% probability.
Figure 3 shows that until around April 1st , an exponential relationship was observable in the number of daily hospital admissions including IBNR. Figure 4 zooms in on the period up to and including 13-4-2020. The dots indicate the number of admissions including IBNR and two curves have been added trying to fit a possible time relationship in the data. The red curve is the exponential best fit on the data and the green curve is the density function of a normal distribution. We see that the green curve fits much better and the decrease in the number of admissions has clearly started.
To predict the number of deaths this method is, however, too simplistic. After all, this is based on all kinds of risk factors, such as age and any comorbidities.
Mortality development and modeling
In addition to hospital admissions and deaths, RIVM publishes daily overviews of the registered patient group by age, gender and underlying conditions (comorbidities). In the plots below, the development of the share in the (hospital) patient population and the status of the observed mortality frequency are represented for a number of important age groups and gender.
Figure 5
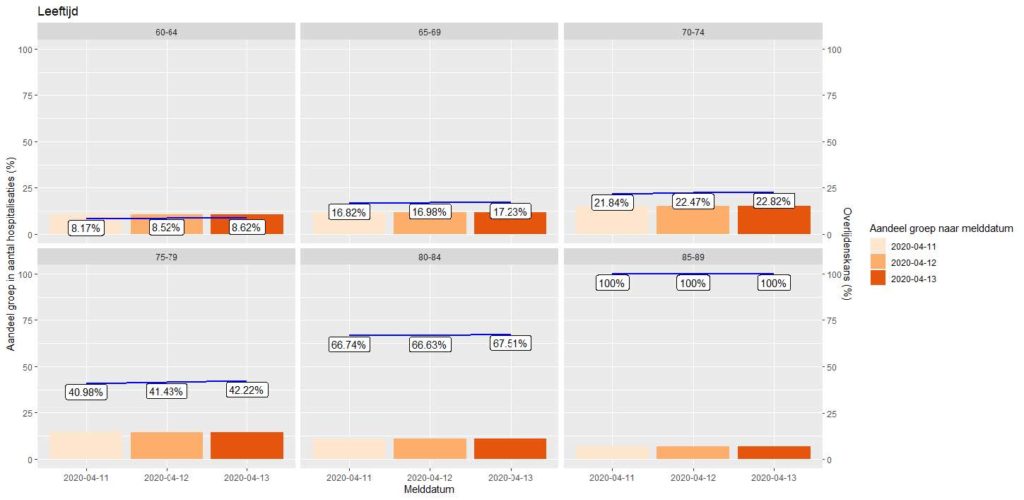
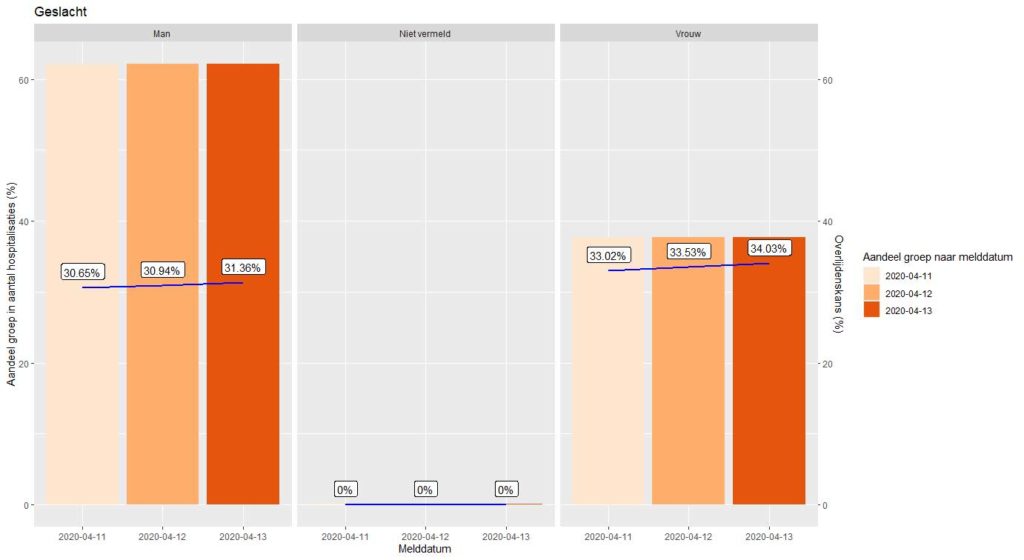
Figures 5 and 6: development in the share of hospital admissions per group (bars) and development in total mortality risk (labels and line).
These plots provide insight (into fluctuations) in the mortality probability within a risk group. To predict future mortality, these data must be viewed on an incremental basis: can the daily mortality be explained by the number of hospital admissions from X number of days earlier?
In order to be able to make an optimal prediction model for future mortality, we would like to combine information on important risk factors from the admitted patients: for example, does it make a difference whether someone has underlying suffering at a younger age and do older men have a lower chance of survival than older women? To provide insight, these risk categories should be available per patient. Unfortunately, RIVM only publishes tables without relationship between gender, age and comorbidities: we can only make models on the three separate series.
Since we can only predict mortality with these three risk factors as separate explanatory variables, the question is what the impact of a split might be. Statistics Netherlands’ Statline provides information about the Dutch population as a whole. Here you will find data on age, gender and syndromes. On the one hand, there are more women in the older age groups (risk factor), but on the other hand it is known that cardiovascular diseases, hypertension, diabetes1 and lung diseases are more common for men than for women. Since this selection of comorbidities is highly relevant in terms of mortality, we see that the gender ratio strongly correlates with comorbidities. We also note that the incidence of comorbidities is strongly correlated with age. If we combined data for the three risk factors, there was a high probability of autocorrelation. Fitting three separate models prevents autocorrelation and estimation differences may indicate that certain trends may or may not be better captured by one or more models.
To arrive at a mortality forecast for the two most recent days and one day ahead, we optimize GLM models from the quasi Poisson family. Generalized Linear Models (GLM) are frequently used in the actuarial profession to quantify risk factors. The explanatory variables in the model capture the effect of the mean hospital stay of a patient in a certain risk class on the probability of dying X days later. With these models we can make a fairly accurate prediction of mortality a few days ahead. Because we also have to make a forecast of the two most recent days that cannot be projected with Chain Ladder, we initially project the mortality for three days in advance. By adding the extra day (the third day ahead) an entire diagonal can be built up in the Chain Ladder model with the next day’s position. The estimates for mortality as of 13-4-2020 are shown in the table and graph below.
| Date | Date of death age model | Mortality Comorb. Model | Mortality Gender model | Average mortality 3 models |
| 12/04/2020 | 73 | 84 | 87 | 81 |
| 13/04/2020 | 49 | 142 | 77 | 89 |
| 14/04/2020 | 91 | 80 | 55 | 75 |
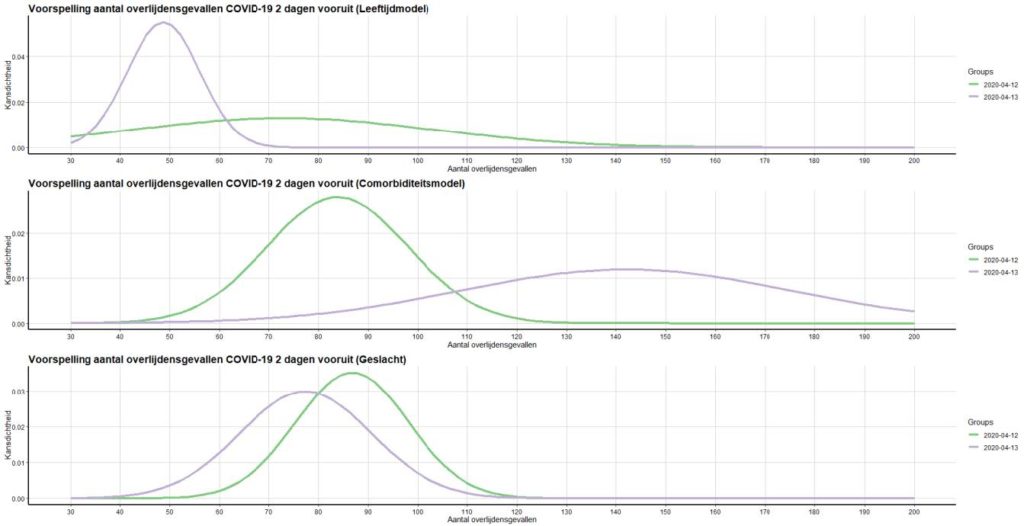
Figures 7 and 8: Mortality prediction by model, including estimated bandwidth.
By averaging the model results, a weighed picture of the total number of deaths in the past days is obtained. With this full estimate for the two most recent days based on the average model results, the pattern of the Chain Ladder model for the two most recent days can be scaled-up. Subsequently, the development in daily mortality (ultimates) can also be displayed. An attempt was made to capture the trend in the data using various “best fitting” functions.
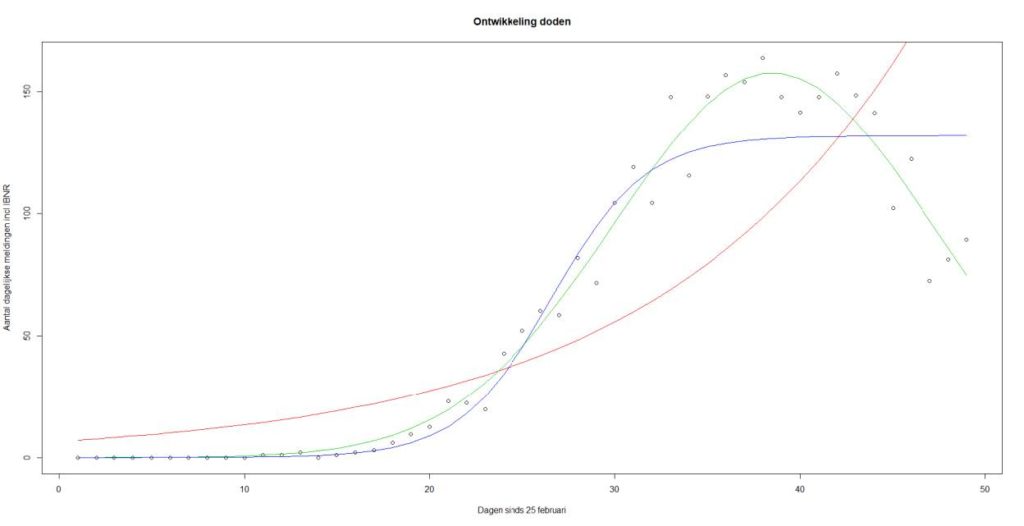
Figure 9: Development of mortality by event day. Red line: exponential relationship, blue line: sigmoid function, green line: Gaussian curve (normal distribution).
The above figure shows a clear downward trend for the number of deaths in the recent week. This is a slightly delayed image that is also visible in Figures 3 and 4 for the number of hospital admissions. The green line (the Gaussian curve) seems to best capture the trend in mortality. We cannot build entirely on an extrapolation of this curve for a mortality forecast. After all, the models recognize that it is very relevant whether there is an influx of new hospital patients and in which risk groups they fall (on average).
Prediction of mortality report RIVM
The RIVM reports daily deaths on reporting day (all deaths reported between 10:01 am the previous day and 10:00 am on the current day). This corresponds to the incremental development on the first future diagonal predicted by the Chain Ladder model. This concerns the prediction of the diagonal as shown in the figure below.
By determining the incremental development between the last reading and the predicted position for the next day (gray diagonal), a prediction for the mortality to be reported by RIVM can be derived. For 14-4-2020, this prediction comes out at 89 deaths.
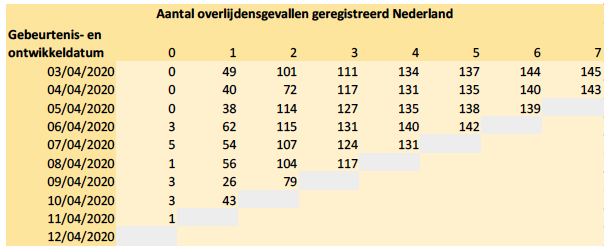
Figure 10: Triangle number of deaths by event and development date.
Forecast
The forecast of further mortality development highly depends on the eventual number of new hospital admissions and the proportions of the number of patients with certain ages and comorbidities. Also, mortality itself still has a stochastic component. The mortality models assume a (quasi) Poisson distribution. For the development in relative proportions of patients per age group and the total number of patients (Figure 3), ARIMA models are used and prediction intervals are derived from them. With the linkage of the mortality models for age groups to the prediction models for the total number of daily hospital admissions (including IBNR) and the relative proportions of the influx by age groups, the mortality in figure 11 is projected 75 days ahead. This projection is shown below on a cumulative basis.
The forecast shown in Figure 11 has a wide prediction interval. The ARIMA model for the inflow of new patients expects a stabilizing low inflow in the near future. However, there is a considerable possibility that the influx will (almost) reduce to zero, so that after a few weeks the mortality will also drop to (almost) zero. This provides an indication of the lower limit for future deaths due to Covid-19.
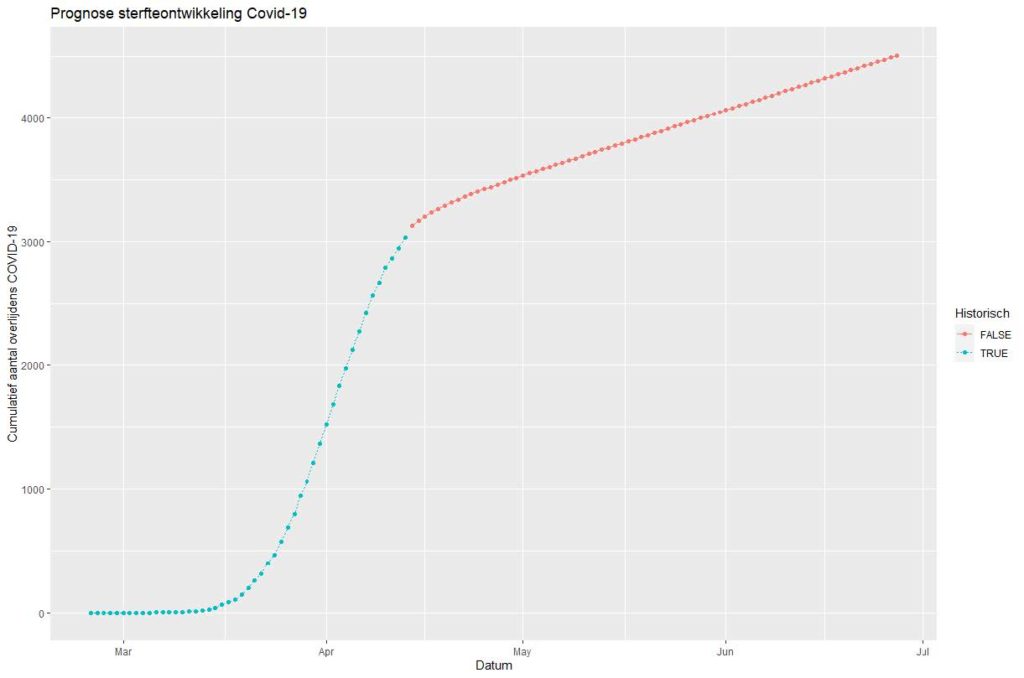
Figure 11: Cumulative mortality and mortality forecast, 75 days ahead. Model based on expected inflow of new patients in age cohorts. Blue: Historical Cumulative Development. Red: predicted future development.
A limitation in these predictions is that they assume unchanged circumstances. These results will have to be adjusted in the event of policy changes, such as more testing or removal of restrictions in society. 9
At the same time, observations by Statistics Netherlands show that the RIVM data probably underestimated the national excess mortality as a result of Covid-19. The projection model described in this article does not capture this missing mortality either. The deaths missing in the RIVM data mainly concern deaths at home or in care institutions where people could not be tested for Covid-19. Therefore, the model results should be seen as only indicative: the number of hospital admissions is likely to be (strongly) correlated with the number of unregistered deaths. This is true in the case that within an age and / or comorbidity group, people are just as likely to recover or die quickly or be ill long enough to be hospitalized. At the moment, at least there is no scientific literature that rejects this assumption.
Actuarial models
All the models mentioned in this article are prediction models widely used in the actuarial profession. The RIVM figures on Covid-19 touch on actuarial topics such as IBNR, GLM pricing models, seasonal patterns (time series) and forecasting. The predictive power of the (combined) models can be tested daily. Back testing and sensitivity analysis are important to provide a robust estimate for the future impact of Covid-19 on Dutch society. As still many developments are expected (for example the reversal of a number of quarantine measures) which may affect the spread of Covid-19, it will be necessary to continuously monitor the development of the hospital admissions and mortality. We are happy to accept the challenge to further develop the actuarial models and to update you on the insights these models provide.
Extreme weather
A changing climate: what impact does this have on P&C insurers?
Melchior Mattens MSc AAG
melchior.mattens@arcturus.nl
Now that 2018 has become one of the driest years in the Netherlands since the start of the precipitation measurements and record temperatures are measured worldwide, insight into climate risks is becoming increasingly urgent for insurers. Each type of insurer is affected differently by the warming climate. More drought, extreme precipitation, heat, cold, hail, lightning and wind storm, not to forget the elevated sea level: all these natural phenomena disturb the stability in claims patterns in various ways. But exactly what effects should a non-life insurer in the Netherlands take into account?
Melchior Mattens MSc AAG
melchior.mattens@arcturus.nl
1. NON-LIFE INSURERS – BUILDINGS, LANDS & CARS
The KNMI uses climate scenarios to translate which effects can be expected for the Netherlands in the medium and long term. The most glaring weather phenomena relevant to damage to property like buildings and cars are storms, hail and extreme rainfall and temperature rise. I will discuss these phenomena one by one. In a warming climate, the likelihood of extreme rainfall intensities, where more rain falls in one or a few hours than drain and soil can absorb. In areas with a relatively low natural absorption capacity (like in urban areas) or in areas where water can accumulate due to funneling (for example in hilly areas), the risks for insurers will increase significantly. In addition, large amounts of rainwater in neighboring countries can lead to a higher frequency of flooding in flood plains and villages and cities close to rivers. However, in many cases these losses are not insured, which means that this does not pose a great risk for most insurers. The same applies to the rise in sea level, because a possible major dike breach is uninsurable in the Netherlands.
The risk of extreme hail also increases. Heat can create stronger and more humid air currents, which can make hailstones much larger than before. Larger hailstones not only have an impact because of the larger surface that is hit by the stones, but the greater weight also increases the speed. This can severely damage the roofs of houses and cars. The extreme hail of June 23, 2016 in the southeast of the Netherlands is an example of this, but also on May 29, 2018, hailstones fell in Utrecht, among others, with a diameter of 3 cm – the size of a golf ball. That large hailstones can fall anywhere in the Netherlands is proven by the observations registered in the European Severe Weather Database (see figure below). Most observations of larger hail are in the east and southeast of the Netherlands.
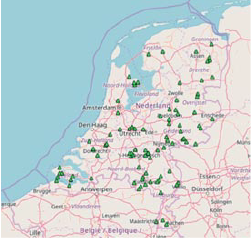
Places in the Netherlands where hail with a diameter of at least 2 cm has fallen since 2006. Source: European Severe Weather Database
Risks for insurers also increase significantly when storms become more frequent and intense. Based on the IPCC report from 2013 and the climate scenarios made by KNMI, it could not be stated with certainty whether storm conditions – with regard to winter storms – for northwestern Europe would change significantly in the coming decades. It is true that the force of local wind extremes is increasing during thunderstorms, for example (also consider whirlwinds and even tornadoes), but due to more buildings in the Netherlands, the average wind speed above land has actually decreased slightly in recent decades. In addition, there are also recent reports from climate and weather scientists showing that the likelihood that powerful tropical storms can reach the Western European coast will increase in a warmer climate.
Then there are the consequences of a rise in temperature. Higher temperatures are associated with more frequent and stronger thunderstorms, which can burn down buildings. This increases fire risk for non-life insurers. However, the likelihood of this culminating in a catastrophe seems limited, even though small insurers can experience a considerably more volatile claims burden when large objects are hit.
A claims source for which Solvency II is currently not yet equipped is the great natural fire risk that can arise from forest fires, for example. Insurers do hold capital for the man-made Fire Catastrophe risk, where all capital is lost in a circle with a radius of 200 meters. However, the likelihood of a large material loss due to large contiguous areas of nature and forest and adjacent villages / cities being (partly) lost also increases. During dry periods with relatively strong winds, forest fires in Europe increasingly appear to be barely or not manageable. This results in great material and unfortunately also human losses. Until now, this has mainly been limited to the southern EU member states, but a country like Sweden also experienced the largest forest fires in its history in 2018. In a warmer climate, the risk of drought – and thus the drying out of soil and vegetation – will also increase in the Netherlands, with a greater chance of wildfires as a result.
Rain, hail, drought and storm are expected to influence the damage burden in different ways. For rain and hail it is quite clear that frequency and strength will increase significantly in the coming decades. This changes both the average and the catastrophe damage burden. Especially the hailstorms with major damage as a result can push the premium up considerably in the Netherlands. This is less clear for storms and droughts. There could be a more frequent autumn storm and drought – if it lasts long enough – could lead to greater damage to nature and property. It is not yet clear whether the insurance premium will be structurally higher as a result.

Minimum- en maximumtemperatuur voor poolgebied, Noord-Amerika, Europa en Rusland – 10-daagse projectie vanaf 24 juli 2018. Record hitte in California (>50oC), Noordelijk Afrika (Algerije >50oC), Japan en Korea (>40oC) en noordelijk Scandinavië (>30oC). Bron: University of Maine (ClimateReanalyzer.org)
2. NON-INSURERS – AGRICULTURE
Likewise, for non-life insurers active in agricultural business, hail, rain and storm are risks that can lead to extensive damage to crops. The described risk of wildfires and drought takes on a different form for agri-insurers. Farmers are often allowed to use little or no natural water resources when drought persists for a longer period of time. As a result, a large part of the harvest can be lost in extremely dry years. Under a ‘broad weather coverage’, insured parties can submit a claim for damage caused by loss of harvest in the event of rainfall shortages – as measured by the KNMI – above a set limit.
It is now clear that the drought in the summer of 2018 is comparable to the drought in 1976. Drought in the Netherlands is also a sign of climate change. Based on the climate scenarios and analysis of drought periods since 1900, the KNMI states that no pattern can yet be found in the frequency and duration of drought periods.
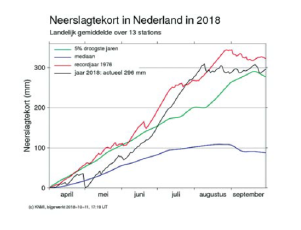
Average nationwide precipitation deficit as measured in 2018. Source: KNMI
The air pressure pattern that keeps rain away is even slightly less common in the Netherlands after 1979 than before. However, the KNMI also states that climate models show more drought when the dehydration of soil and vegetation in the Netherlands – partly due to higher temperatures – becomes more comparable to the Mediterranean area. With the (probably) four hottest years in a row (2015-2018) since the measurements started in 1900, this is starting to become an increasingly likely scenario. For the insurance business with insured agriculture, forestry and fruit cultivation, it is expected that extreme precipitation from rain and hail can strongly influence the premium. The catastrophe scenarios will also deteriorate considerably. However, with regard to drought, it is still the question whether the frequency will increase significantly.
OVERVIEW
Long-term trends of higher average claims and more extreme catastrophes have a direct impact on insurers’ pricing, underwriting and capital policy. In addition, a demand may arise for new types of insurance where the insurer can meet a social need with more prevention measures and advice.
Pensions – Intergral risk management
Pension funds are and have faced various challenges, such as the credit crisis, withdrawal of sponsors or the pension issue in 2020. Pension funds have taken numerous measures in the field of risk management.
Integrated risk management plays an important role in (administrative) management of challenges. By applying integrated risk management, a self-learning and self-managing organization is created that is aware of the impact of the various risks and their correlations, as well as of the options for control and the various consequences thereof. The continuous process of updating or drawing up the risk strategy documents, implementation, monitoring and evaluation must remain on the boards agenda. Their responsibility is continuous. The details of this continuous process strongly depend on the organization of the pension fund.
Often there is a collaboration between an internal party (pension agency or risk committee) and an independent external party or entirely outsourced to an independent external party.

VISION OF ARCTURUS, METHODOLOGY AND COOPERATION
Arcturus is an independent party that is happy to support your pension fund board with integral risk management. With a good framework of documents drawing up the strategic risk management of your board, the focus of you and Arcturus can be more on the area of integrated risk management, in which the attitude will be more proactive than passive or defensive. Arcturus’ activities can be divided into two areas:
- Establishing integral risk management
- OEstablishing integral risk management – Supporting the board in applying integral risk management
Arcturus’ activities for setting up the integral risk management can be as follows:
- Mapping existing documents regarding, among other things:
o pension fund objectives,
o pension fund objectives,
o overview of the risks,
o risk attitude / acceptance,
o defined risk strategy,
o defined control measures,
o action plan,
o established responsibilies in the continuous process and
o recorded periodic assessment. - Checking with the board and implementation sections whether the present documents are still applicable.
- Check with the board and implementing organizations whether the documents already present containing the records are still applicable.
- Supplementing, modifying or redesigning the documentation of integral risk management in such a way that it becomes manageable for the board.
- Formalizing the structure of the minutes in such a way that the board is supported in taking decisions in the context of integrated risk management.
- Formalizing the set-up of the agenda in such a way that the board is supported in applying integrated risk management
- Reviewing the prepared documentation with the board and De Nederlandsche Bank.
- Processing any feedbacks.
When supporting the board in the application of integrated risk management, the activities may be as follows:
- Preparing of board meetings, whether or not in collaboration with (external) parties by means of short and concise reports.
- Provide support at board meetings in the context of integrated risk management; give unsolicited advice.
- Keep documentation up to date.
- Relevant developments (e.g. in the field of regulations), inc
We are happy to make arrangements with your board in advance to create clear communication between all parties involved. By scheduling regular meetings, we keep you informed of the schedule and progress of our work. In addition, we will inform you immediately when there are developments that may be of interest to you. IDents and concerns will be shared with the board.
THE ADDED VALUE OF ARCTURUS
Arcturus is an actuarial agency with the following characteristics:
- High quality for a competitive price
- Arcturus prefers to work with a fixed price
- A committed and proactive attitude
- Extensive experience in risk management
Model validation: what’s in it for you?
Model validation is not mandatory.
Angela van Heerwaarden
angela.vanheerwaarden@arcturus.nl
As a smaller insurer you may think: “only necessary if it is mandatory”.
This obligation is laid down for insurers that use their own internal model for the required solvency capital under Solvency II, and not the standard formula. In Dutch practice, these are indeed only a few large insurers.
Much larger insurers are now applying this mandatory model validation to a much wider range of models. The obligation has led to a major quality improvement in model management (‘governance’) across the board, reducing risks.

Angela van Heerwaarden
angela.vanheerwaarden@arcturus.nl
Model validation is expensive and yields little
In 2018, news had it that some US Aegon subsidiaries were using asset management calculation models that contained ‘numerous errors’ and ‘did not work as promised’. The errors weren’t surprising in hindsight, as all the modeling work had been done by one junior analyst and not checked by anyone. This resulted in a $ 97 million fine imposed by the US SEC for misleading investors. So it turns out that the lack of model validation can be quite expensive!
You may think this is exceptional? Uncontrolled models are never implemented in your practice? Our experience in insurance practice is different.
Often enough there is nothing more than ‘4-eyes’ checking: calculations are checked, but not sufficiently independently tested, so that thinking errors can remain in the design of a model. Data sources outside the model are not always properly controlled. Model changes are only marginally checked.
And also think of the ‘key-person risk’, where your organization relies heavily on that one actuarial specialist – possibly even an externally hired specialist. Is he or she flawless? And what about that ‘externally validated tool’ from the specialist: are the assumptions and parameters used really suitable for your portfolio? You don’t really know without validation.
What can be the yield of model validation? Estimate the maximum consequences of a ‘stupid mistake’: an error that could possibly persist for years without anyone signalling the outcome as illogical. Including fines and reputation risk, this can be quite expensive. And your company was managed on the basis of incorrect data during that time . This analysis gives you insight into the budget that you are willing to allocate for better model management.
Model validation is far too difficult
You can take a big approach by drawing up a general validation policy and setting up a new department for it. But it actually includes some essential steps that belong to the ‘primary care’ tasks, such as:
- rules for model management,
- model documentation,
- standard for statistical quality and arithmetic correctness,
- standard for calibration of parameters,
- rules for the use of external models and data.
During the model validation, a checklist is made along all these components and an independent, critical person assesses whether all criteria have been demonstrably met. The ‘difficult’ thing is that the requirements for a good model are made visible, and that in most cases the quality of management and documentation must be improved in order to ‘pass’ the model validation. But once that quality improvement has been made, validation becomes increasingly easier.
In our experience, validations always reveal errors. In addition, it provides valuable information for second line functions, in particular Actuarial and Risk management. The result is a transparent picture of the reliability of the model and outcomes, on which they must advise the management.
Model validation – let’s get started!
It goes without saying that Arcturus is ready to validate the most important actuarial models: premium setting, reinsurance, technical provisions, solvency capital and ORSA.
We propose a pragmatic approach, starting with a risk inventory. Then the board selects the priorities, such as an initial validation for new models, and a regular validation frequency of once every three years.
Arcturus has extensive experience in model validation and can easily adapt a ‘standard’ validation policy to suit your organization. Validation can then be coordinated on a project basis per model. We can help the first line to organize the model and documentation, and we have enough experts to send an independent validator along afterwards.
Validation projects are also easy to plan in the less busy periods of your team.
Reinsurance optimization
Michiel van Dellen
michiel.vandellen@arcturus.nl
An important and difficult part of risk management for an insurer is optimizing reinsurance. Purchase of reinsurance influences the profit, the legal capital requirement and the future financial position of the insurer. There are several aspects of reinsurance that make it difficult to select a reinsurance product.

Michiel van Dellen
michiel.vandellen@arcturus.nl
Buying reinsurance often involves a lower profit margin. The reinsurer requires part of the expected profit to take over the risk from the insurer. But which part is realistic? And how much is the risk reduced by a specific type of reinsurance? Is the impact of the reinsurance choice on the Solvency II capital requirement sufficiently taken into account? Thanks to years of experience in the non-life actuarial profession, Arcturus has developed methods to adequately support insurers in this choice.
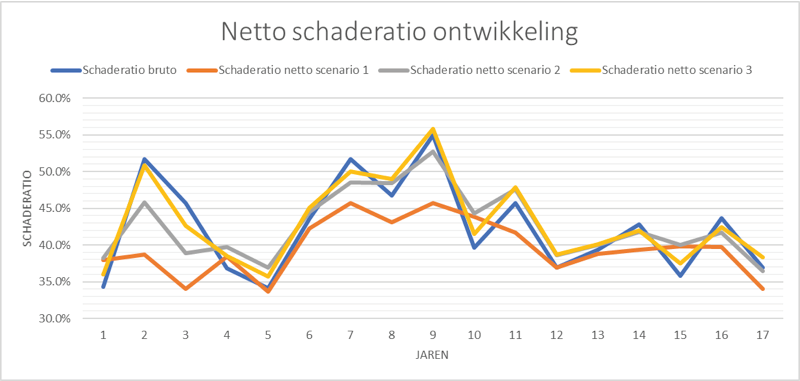
Example of how different reinsurance contracts can stabilize an insurer’s claims ratio.
For you as an insurer it is important to know what the risk drivers are in your portfolio. Arcturus can inventory and quantify this together with you. Also consider:
- The impact of climate change on weather damage
- Amendments to Liability Law
- Relevant catastrophe scenarios based on geographic features of your portfolio
Based on these results, an optimal reinsurance program can be determined for you. Which reinsurance program is most efficient for you? How much risk do you want to spend and how much are you willing to pay for it?
Arcturus calculates the effects of various programs on your capital position for you.
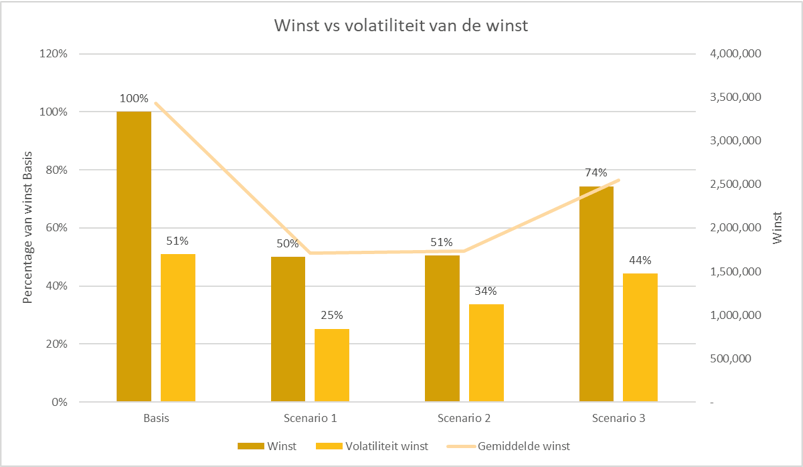
More profit and volatility, or less risk? Which scenario is most suitable for you?
Would you like more information or are you interested in what Arcturus can do for you? Please do not hesitate to contact us!
Want to know what Arcturus can do for you?
Would you like to know more about how that works and what we as Arcturus can do for your company. Leave your details here and we will contact you without any obligation to discuss your options.